The nucleus burning inside of the cell
My previous post looked at 2016 turnout and results in cities across Wisconsin, but had some specifically interesting findings about Milwaukee. As the state’s largest and least white city, Milwaukee plays a polar role in Wisconsin politics (as do similar cities in their states’ politics — Detroit, Chicago, etc.). It’s a conservative scare tactic, often paired with liberal Madison in a two-tone dog whistle meant to remind the rural population who’s taking all their money.
Wisconsin is, by some measures, the worst state in which to be black, and Milwaukee itself is one of the most segregated cities in America. The voter ID law that kept 77-year-old Delia Anderson out of the voting booth for the first time since the 1950s is by no means the first assault by Wisconsin conservatives on the people of Milwaukee.
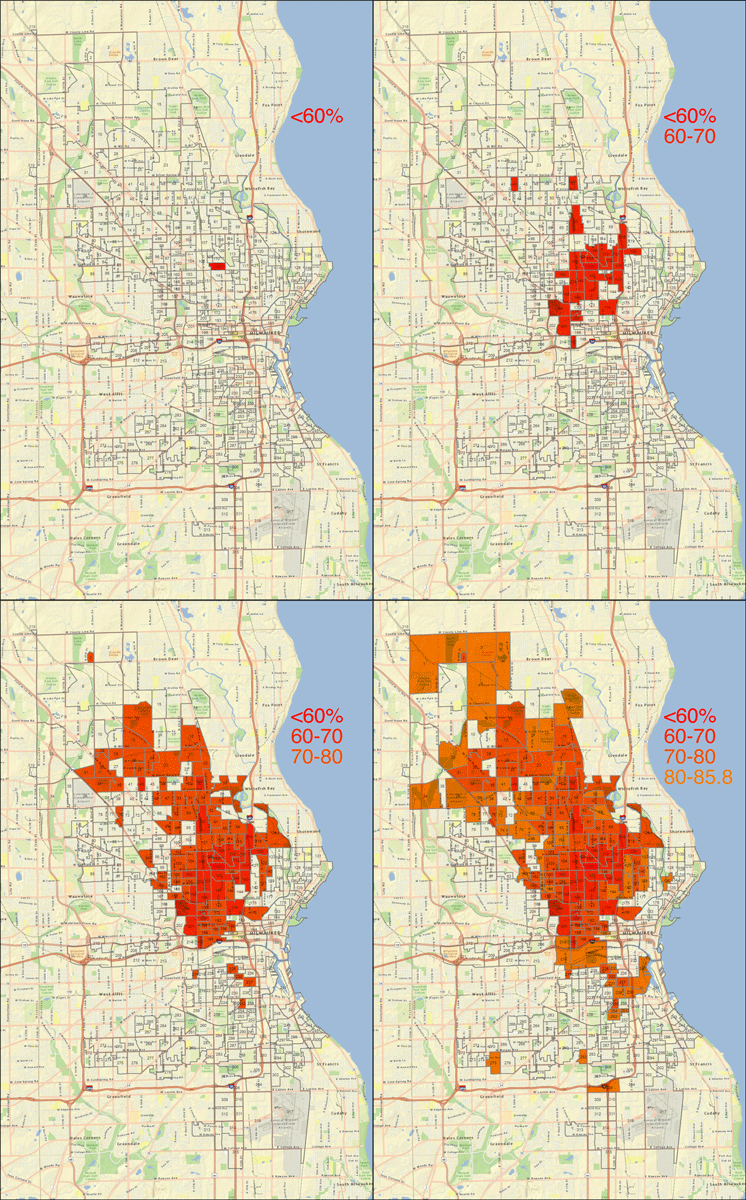
One of the key results that I found in the turnout data was the steep decline in voting in the city of Milwaukee from 2012 to 2016. Given the city’s high level of segregation and the targeted nature of the voter ID law, there’s good reason to expect that the 14.6% average drop in total votes cast would not be uniform across the city. Luckily, Milwaukee adopted its current voting ward map in 2011, meaning that the same map was used for both 2012 and 2016, allowing for direct comparison. What we don’t know is the extent of movement in and out of the city, or between wards within it, but Census Bureau estimates don’t suggest any major changes in population distribution between the two elections.
Milwaukee has 323 voting wards that can be legitimately analyzed (three had zero votes in either election, and one had four votes in 2012 and five in 2016). Only 16 of them had more ballots cast in 2016 than in 2012, and they’re largely in well-off, mostly white areas — Bay View, downtown and the Third Ward, the tony Northpoint neighborhood. They’re almost all on the east side, with the exception of a couple on the far west that border Wauwatosa.
Meanwhile, 158 wards had turnout proportional to 2012 that was worse than the city average of 85.8%, including 30 that were at 70% or below. Look at, and compare, the extent of turnout decline by voting ward and 2000 census data on percentage of residents in each tract who are black:


The ready explanation for this is, well, Barack Obama wasn’t on the ballot, so obviously black voters aren’t going to turn out. This is a very convenient argument for how tens of thousands of black voters disappeared in Wisconsin, but until I see some strong data it’s hard to buy the idea that upwards of 30% of black voters were only showing up for Obama and didn’t recognize the existential threat presented by Donald Trump. It’s also important to note that we can’t account for the impact of the voter ID law just by looking at how many people were turned away at polling places. There are also those who knew (or thought) they didn’t have the necessary ID and couldn’t expend the resources to get it, those who were hassled in a previous election and didn’t want to bother with it again, and those who weren’t sure but did know they’d been told repeatedly that voter fraud is a felony. It could go without saying that the state will not support any efforts to do rigorous study about this, but hopefully there is funding to be secured by scholars at UW-Madison or UW-Milwaukee, as long as the state doesn’t threaten to defund the school as a result.
(Thanks to The Both, whose “Milwaukee” provides the post title.)

